
Pythonで、Google Sheets APIでスプレッドシートを操作する方法をご紹介します。
pandasでピボットテーブルを作成して、スプレッドシートにデータ転記する方法と、
スプレッドシートに書式設定をする方法を解説します。
※事前にAPIキーを取得しておく必要があります。
Google Sheets API スプレッドシート操作
以下のコードを実行すると、WebAPIでスプレッドシートを操作します。
import gspread
from google.oauth2.service_account import Credentials
import pandas as pd
from gspread_dataframe import set_with_dataframe

#認証
scopes = [
    'https://www.googleapis.com/auth/spreadsheets',
    'https://www.googleapis.com/auth/drive'
]

credentials = Credentials.from_service_account_file(
    'xxx.json',
    scopes=scopes
)

gc = gspread.authorize(credentials)

#スプレットシートとシート指定
SP_KEY='1XH6cyl6ES5TeWuQR6613Jum0VDS0sb_DQzYWTdzAKTU'
SP_SHEET='test'

#スプレッドシート開く
sh=gc.open_by_key(SP_KEY)

#シートを変数格納
ws=sh.worksheet(SP_SHEET)

#スプレッドシート 全データ読込
data=ws.get_all_values()

#pandasで読込 B列から読込 1行目はタイトル行として認識させる
df=pd.DataFrame(data[2:],columns=data[1])

#空の列を除く
df=df.drop(df.columns[[0]], axis=1)

#ピボットテーブル作成
df=df.astype({'得点': int,'ID':int})
pvt_table=df.pivot_table(index='配属',values='得点',aggfunc='sum')

#新規シート追加
new_sh=sh.add_worksheet(title='new',rows=50,cols=50)

Output_row=2
Output_col=2

set_with_dataframe(new_sh,pvt_table.reset_index(),row=Output_row,col=Output_col)
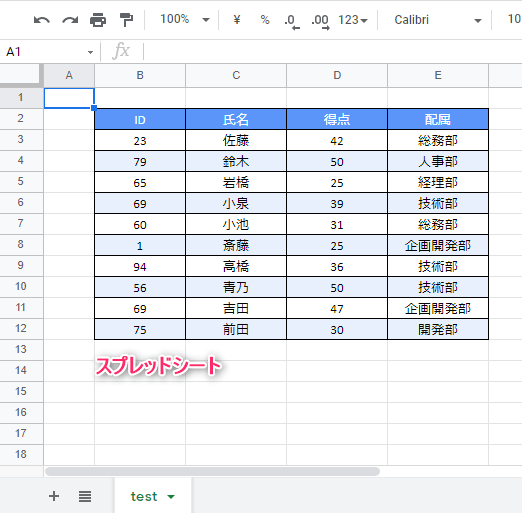
コード実行前
スプレッドシートを事前に準備しておきます。
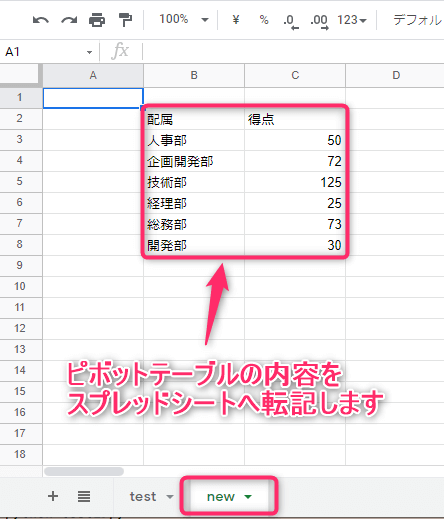
コード実行後
「test」シートのデータでピボットテーブルを作成して、結果を「new」シートに転記します。
(「配属」ごとの得点合計を転記しています。)
Google Sheets API スプレッドシート書式設定
以下のコードを実行すると、WebAPIでスプレッドシートを操作します。
import gspread
from google.oauth2.service_account import Credentials
from gspread_formatting import *

#認証
scopes = [
    'https://www.googleapis.com/auth/spreadsheets',
    'https://www.googleapis.com/auth/drive'
]

credentials = Credentials.from_service_account_file(
    'xxx.json',
    scopes=scopes
)

gc = gspread.authorize(credentials)

#スプレットシートとシート指定
SP_KEY='1XH6cyl6ES5TeWuQR6613Jum0VDS0sb_DQzYWTdzAKTU'
SP_SHEET='test'

#スプレッドシート開く
sh=gc.open_by_key(SP_KEY)

#シートを変数格納
ws=sh.worksheet(SP_SHEET)

#スプレッドシート 全データ読込
data=ws.get_all_values()

#色付けする範囲
header_range='B2:E2'
value_range='B2:E12'

#フォーマット指定
header_fmt=cellFormat(
    backgroundColor=color(0.9, 0.9, 0.9),
    textFormat=textFormat(bold=True,foregroundColor=Color(0.5, 0.5, 0.5)),
    horizontalAlignment='CENTER'
)

#枠線
border=Border("SOLID",Color(0,0,0,0))
border_fmt=CellFormat(borders=Borders(top=border,bottom=border,left=border,right=border))

#書式適用
format_cell_range(ws,header_range,header_fmt)
format_cell_range(ws,value_range,border_fmt)
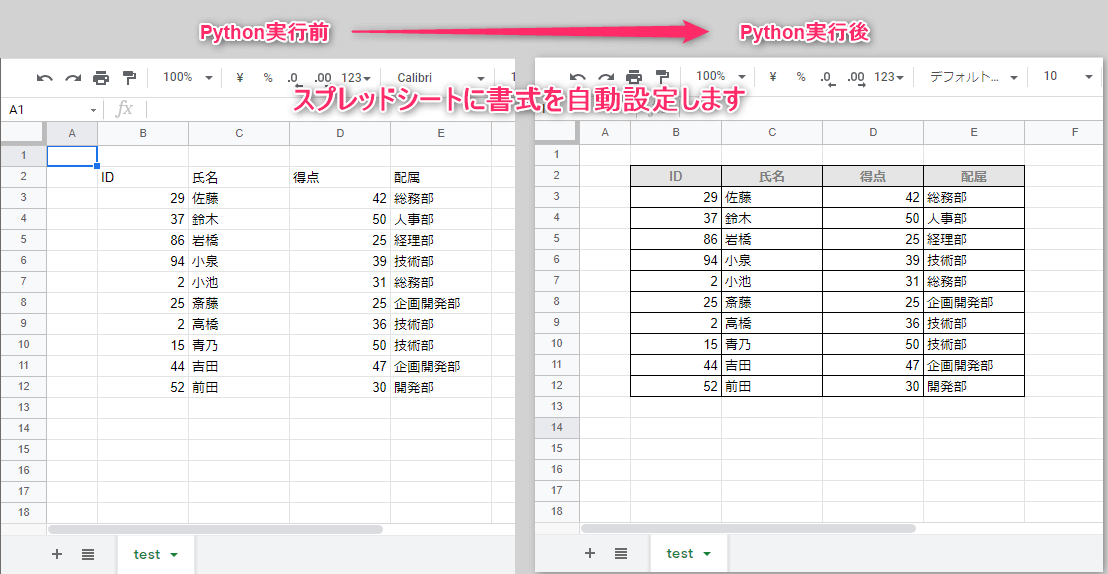
コード実行後
スプレッドシートに枠線を引いて、特定セルに色付けします。
この記事がお役に立ちますと幸いです🍀

【Python】WebAPIからCSV出力:Pandas使用
Pythonで、WebAPIからCSV出力する方法をご紹介します。WebAPIから抽出項目を絞って、指定件数をCSV出力します。ぜひお試しください!WebAPIからCSV出力(ホットペッパー)以下のコードを実行すると、APIを読み込んでCS...
kirinote.com
2026.07.29
「Python[完全]入門」
「この一冊で」しっかりやさしく学べるPythonの教科書
はじめてプログラムを行う人でも安心して読み進められる!
リンク